console-graph
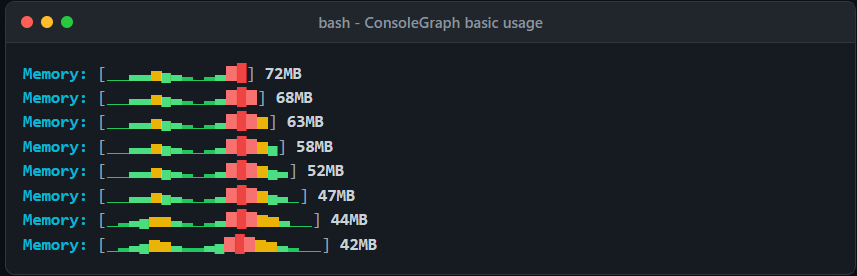
A tiny, zero-dependency sparkline logger that turns your console into a real-time dashboard.
Track numerical values over time with beautiful, color-coded ASCII/Unicode sparklines. Works natively in Node.js and modern web browsers.
Why console-graph?
When debugging or monitoring, printing long lists of raw numbers makes it incredibly hard to spot trends, spikes, or periodic patterns.
console-graph transforms raw data into high-density visual trends directly in the log line, requiring zero configuration, zero external GUI, and zero dependencies:
Key Features
⚡ Zero Config & Deps
Super lightweight (~3KB footprint) and starts working immediately with zero setup or external packages.
🌐 Platform Agnostic
Consistent high-fidelity visual rendering across both Node.js terminals (ANSI) and browser DevTools (CSS).
🎨 Color Gradients
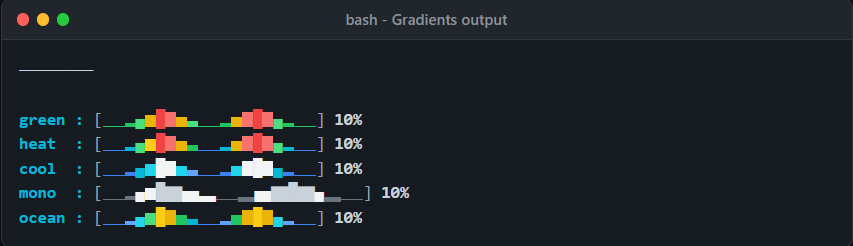
5 built-in color themes (green, heat, cool, mono, ocean) to instantly signify severity and metrics intensity.
📈 Auto-Scaling
Dynamically normalizes and adjusts the height of Unicode blocks based on the min/max range of active buffers.
📊 Live Dashboards
Group and monitor multiple metrics simultaneously in-place with clean terminal line-clearing updates.
🛠️ Highly Customizable
Tailor brackets borders, scale bounds, buffer limits, and custom formatting callbacks to your liking.
Visual Themes at a Glance
The library comes pre-packaged with distinct color gradients tailored to different types of streaming data:
| Theme | Visualization | Ideal For |
|---|---|---|
green |
   |
Standard metrics (low = good, high = alert) |
heat |
  |
Temperature, throughput, heavy resource usage |
cool |
 |
Memory occupancy, quiet background tasks |
ocean |
|
Spiky latencies, waves of request-response logs |
mono |
 |
High-contrast, minimal layout |
Quick Example
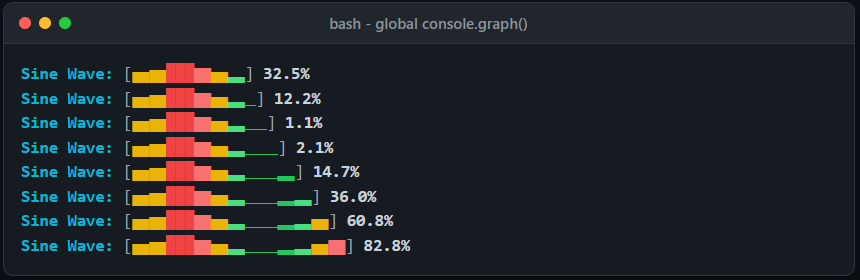
Registering the module adds a global method to the console object, making debugging a breeze:
import 'console-graph/register';

// Start graphing immediately!
console.graph(45, { label: 'CPU', unit: '%' });
console.graph(52, { label: 'CPU', unit: '%' });
console.graph(78, { label: 'CPU', unit: '%' });
// Output: CPU: [▁▃█] 78%
The global register module caches and updates instances automatically:
Rich Statistics & Customizations
console-graph supports running stats calculations and highly custom rendering formats out of the box:
Sliding Window Statistics
Append running minimum, maximum, and average indicators to the terminal line:

Custom Formatting & Brackets
Design custom enclosures and metric display formatters (like ms logs or currency symbols):

Next, dive into the Getting Started guide to install and configure console-graph in your application!